水力学论文

摘 要: 为了研究小湾水电站高坝坝身泄洪噪声的影响范围以及各生产主要区域的噪声分布情况, 首次开展了较系统的泄洪噪声原型观测工作。利用AR844在线式数字噪声计测量各观测工况噪声值, 对比泄洪前后噪声分贝值, 分析、总结噪声的主要影响、衰减规律, 为小湾水电站运行管理人员的职业健康提供相关资料, 以达到验证设计及趋利避害的目的。成果表明, 离坝址越远, 噪声的衰减越明显, 泄洪噪声最大影响范围在坝下游约1.3km左右。
关键词: 原型观测; 坝身泄洪; 噪声; 衰减规律;
Abstract: In order to study the impact of dam body discharge noise and the noise distribution in each major production area of Xiaowan hydropower station, a systematic archetypal observation work on flood discharge noise is carried out for the first time. Using the AR844 online digital noise meter to measure the noise values in each observation condition, compare the noise decibel value before and after the flood discharging, analyze and summarize the main influence and attenuation law of the noise, and provide relevant information for the occupational health of the operation manager of Xiaowan hydropower station, so as to achieve the purpose of verifying the design and avoiding the harm. The results show that the farther away from the dam site, the more obvious the attenuation of the noise, the maximum impact of flood discharge noise reaches about 1.3 km downstream of the dam.
Keyword: archetypal observation; dam body discharge; noise; attenuation law;
0 引言
小湾水电站枢纽建筑物由混凝土双曲拱坝、右岸地下引水发电系统和泄水建筑物组成。电站装机容量4200MW, 坝顶高程1245m, 正常蓄水位1240m, 总库容149.14×10⁸m3。工程最大下泄流量为20700m3/s, 最大水头255m。小湾工程泄洪消能布置采用5个坝顶溢流表孔、6个坝身中孔、左岸一条泄洪洞, 坝后设水垫塘和二道坝, 坝身设2个放空底孔的泄洪消能布置方案。5个表孔均为开敞式溢洪道, 堰顶高程均为1225.0m, 各孔口尺寸11m×15m (宽×高) , 5个表孔最大泄量为8625m3/s。坝身6个泄洪中孔为有压深式泄水孔, 出口工作门孔口尺寸6.0m×6.5m (宽×高) , 6个中孔最大泄量为8264m3/s。
小湾水电站地处狭谷, 坝身泄洪各工况下, 高水头大流量泄洪消能会引起局部区域环境量的变化。实测结果总体表明:坝身泄洪会造成局部声场、风速场、温度场、湿度场的变化[1,2,3,4,5,6]。噪声对人的生理健康与心理健康均有一定危害。根据现场情况, 初步认为小湾水电站泄洪噪声场以河道两岸、1150m高程和坝顶高程距水垫塘较近区域变化明显, 据此制定观测方案。
目前有关高坝泄洪噪声影响的相关研究资料较少, 没有较成熟的理论支撑。本研究不仅可以为运行管理人员的职业健康提供相关资料, 还可以为高坝泄洪噪声分布研究提供数据支撑。
1 噪声观测仪器及测点布置
本次采用AR844在线式数字噪声计进行观测, 仪器测量范围为30dB~130dB, 精度为±1.5dB。
坝身泄洪噪声观测布置区域主要包括中控室、闸门操作室、小湾永久大桥、坝顶公路、中线公路沿程主要建筑物及路口等。按照从坝址向下游布置测点:SD布置在坝顶, 1R7~1R9、1SR1~1SR9布置在右岸低线公路, 2SR1~2SR11布置在右岸中线公路, 3SR1布置在中控室, 3SR2~3SR6布置在右岸坝顶公路;1SL1~1SL6布置在左岸低线公路, 2SL1~2SL8布置在左岸坝顶公路;SQ、Q1~Q5布置在小湾永久大桥。噪声测点布置见图1。
2 观测成果分析
2.1 泄洪中孔全开噪声分布规律
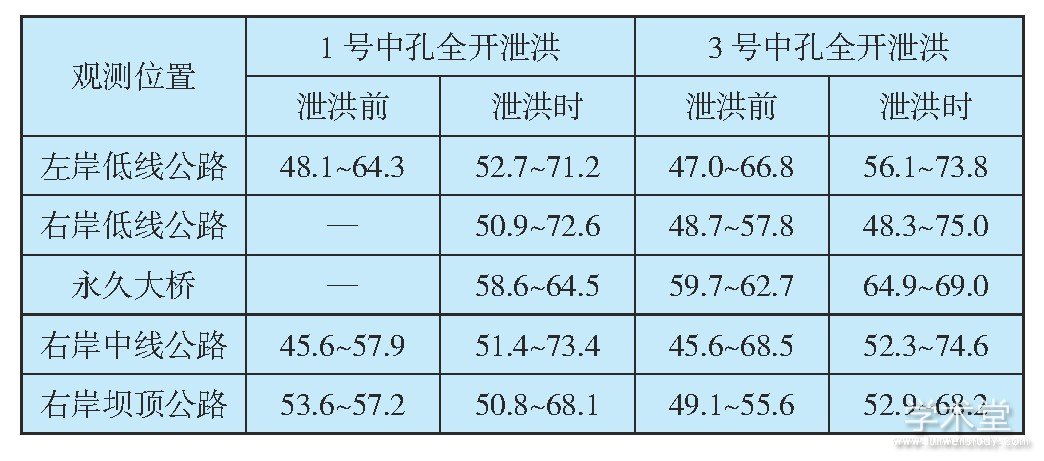
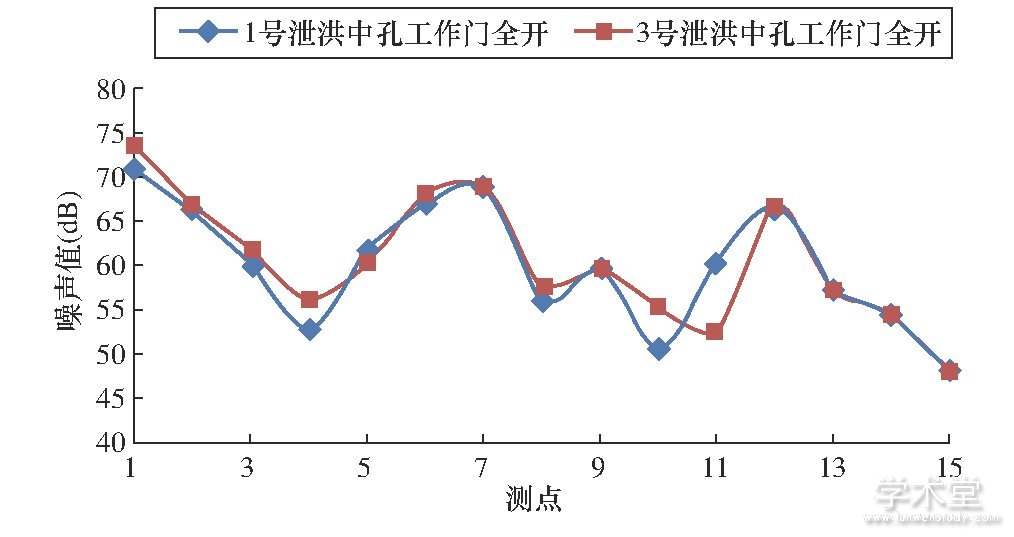
分析表1及图2、图3可知:两工况泄洪时测点噪声较泄洪前总体增大。两工况泄洪时, 左岸低线公路沿程噪声值接近, 介于0.4%~3.5% (相对3号中孔全开泄洪, 下同) ;右岸低线公路沿程和永久大桥处噪声值略有差别, 介于5.8%~16.2%;右岸中线公路与坝顶公路沿程噪声值相差不大, 介于0~7%。观测点距离大坝坝址越远, 噪声值越小。3号泄洪中孔泄洪时各测点噪声值总体略比1号中孔泄洪时高。
图1 噪声测点布置Fig.1 Layout of noise measuring points
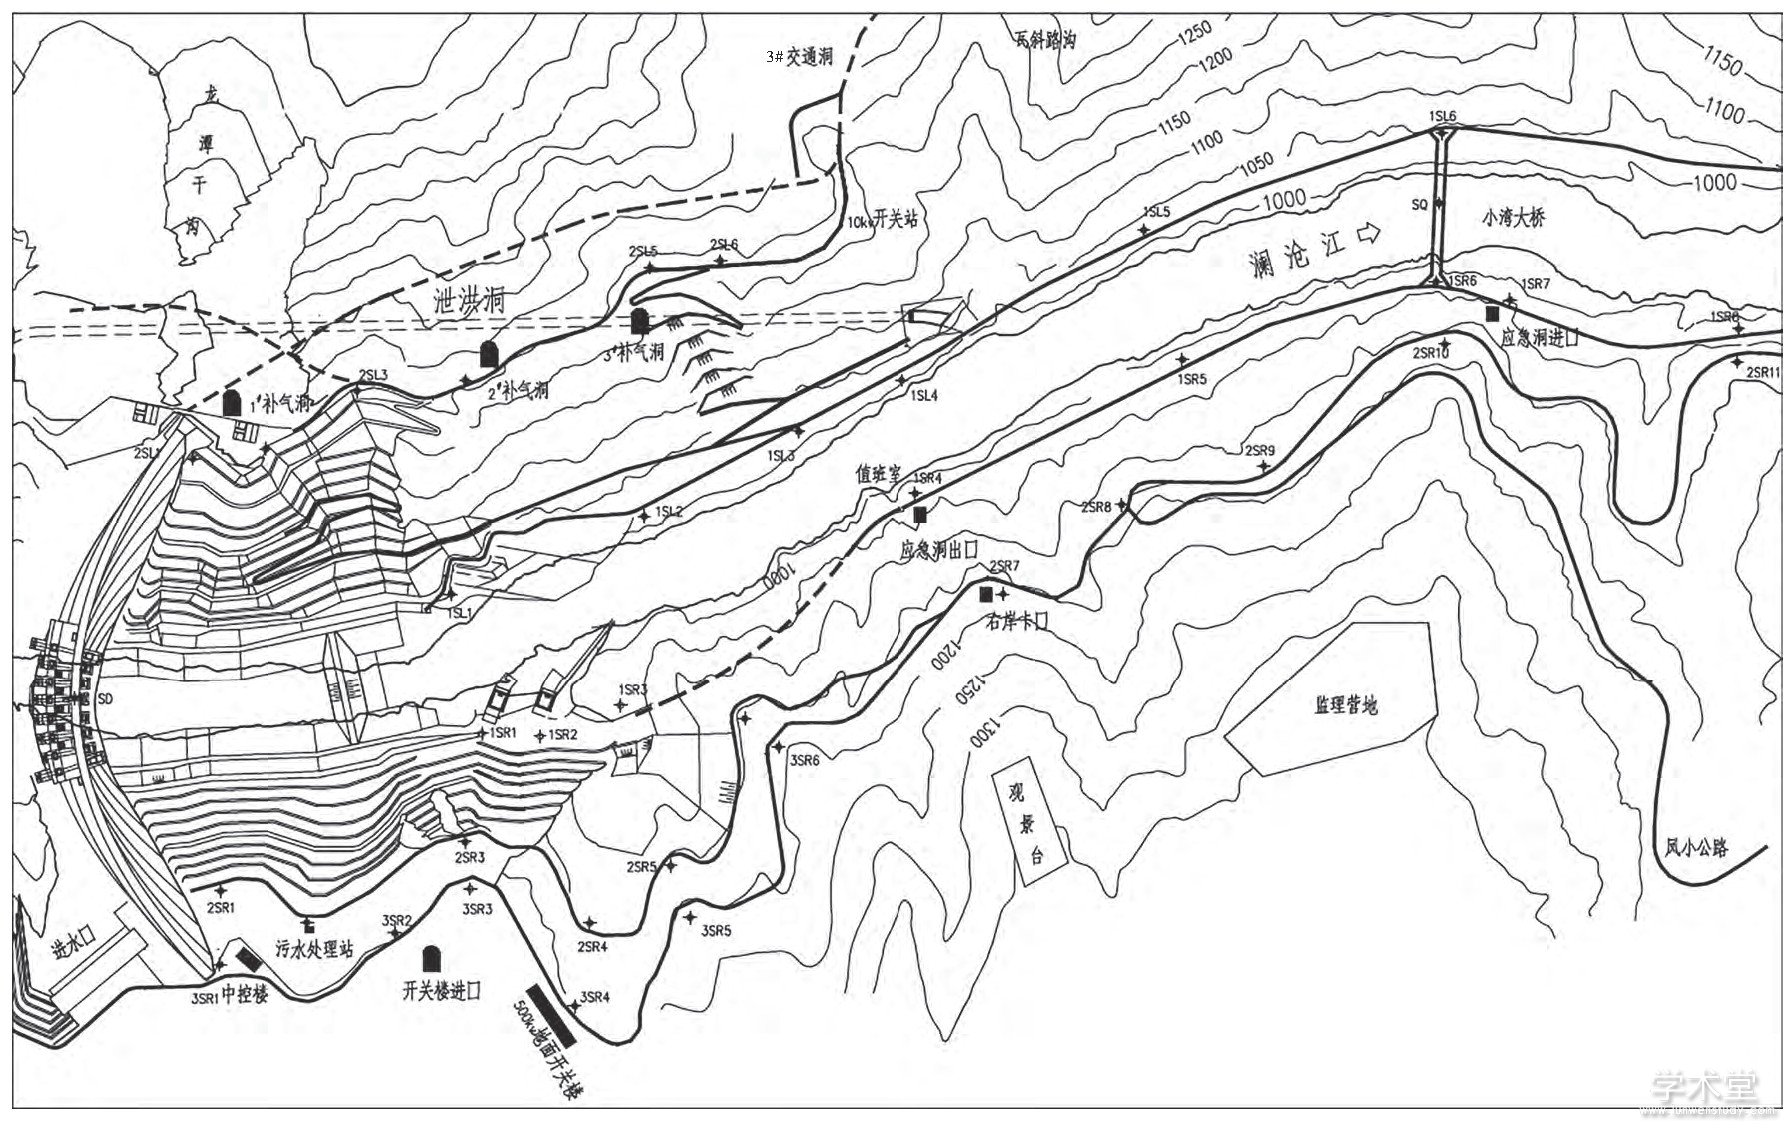
表1 1、3号泄洪中孔全开工况泄洪噪声值统计表d B Tab.1 Flood discharge noise value statistics when1#or 3#middle outlet is fully opened respectively d B
2.2 泄洪表孔全开噪声分布规律
分析表2及图4、图5可知:两工况泄洪时测点噪声值较泄洪前总体增大。两工况泄洪时, 左岸低线公路、左岸坝顶公路沿程和永久大桥处噪声值接近, 介于0.1%~6.5% (相对3号表孔全开泄洪, 下同) ;右岸低线公路和右岸坝顶公路沿程噪声值相差不大, 介于0.5%~9.7%;只有右岸中线公路沿程噪声值略有差别, 介于0.2%~14.8%。观测点距离大坝坝址越远, 噪声值越小。3号表孔全开泄洪时各测点噪声值总体略比2号表孔全开泄洪时高。
图2 泄洪时左岸噪声分布Fig.2 Noise distribution on left bank during flood discharge
(1~6号观测点分别代表1SL1~1SL6, 7号观测点代表SQ, 8号观测点代表Q2~Q3, 9~15观测点代表2SL1~2SL7) (The measuring points No.1 to No.6 represent 1SL1 to1SL6, No.7 represents SQ, No.8 represents Q2-Q3, and No.9 to No.15 represent 2SL1 to 2SL7, respectively)
图3 泄洪时右岸噪声分布Fig.3 Noise distribution on right bank during flood discharge
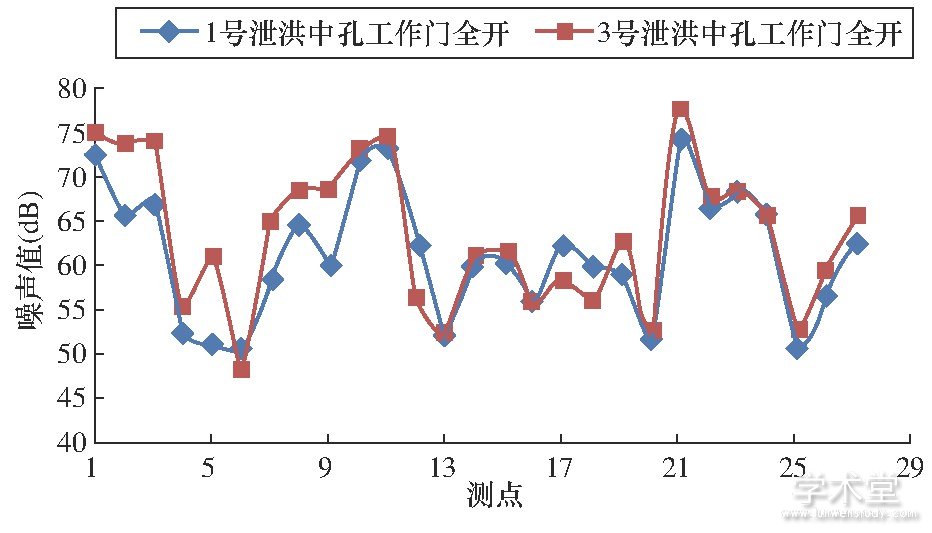
(1~6号观测点分别代表1SR1~1SR3和1SR7~1SR9, 7~9号观测点代表Q1~Q3, 10~20号观测点代表2SR1~2SR11, 21号观测点代表SD, 22~27观测点代表3SR1~3SR6) (The measuring points No.1 to No.6 represent 1SR1 to 1SR3and 1SR7 to 1SR9, No.7 to No.9 represent Q1 to Q3, No.10to No.20 represent 2SR1 to 2SR11, No.21 represents SD, and No.22 to No.27 represent 3SR1 to 3SR6, respectively)
表2 2、3号泄洪表孔全开工况泄洪噪音值统计表dB Tab.2 Flood discharge noise value statistics when2#or 3#surface outlet is fully opened respectively d B
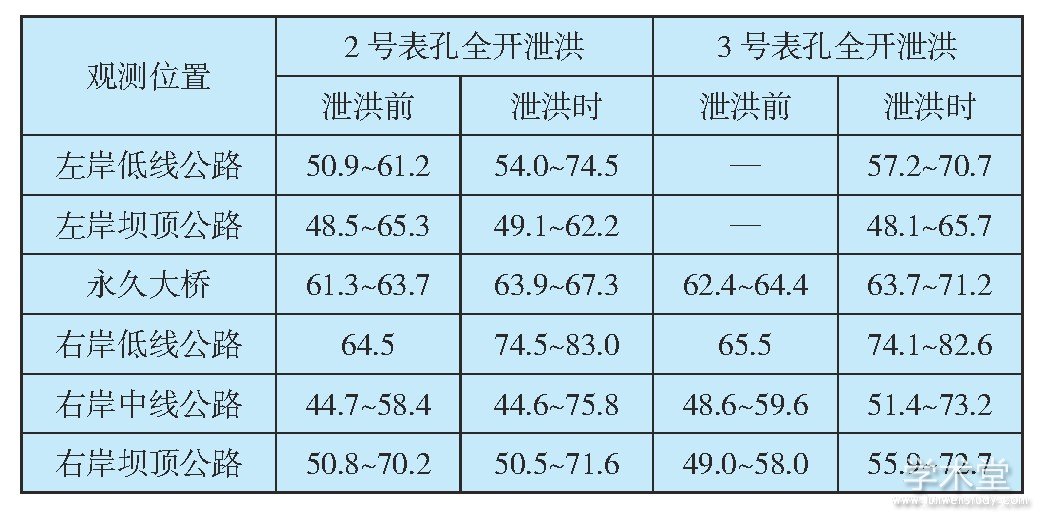
图4 泄洪时左岸噪声分布Fig.4 Noise distribution on left bank during flood discharge
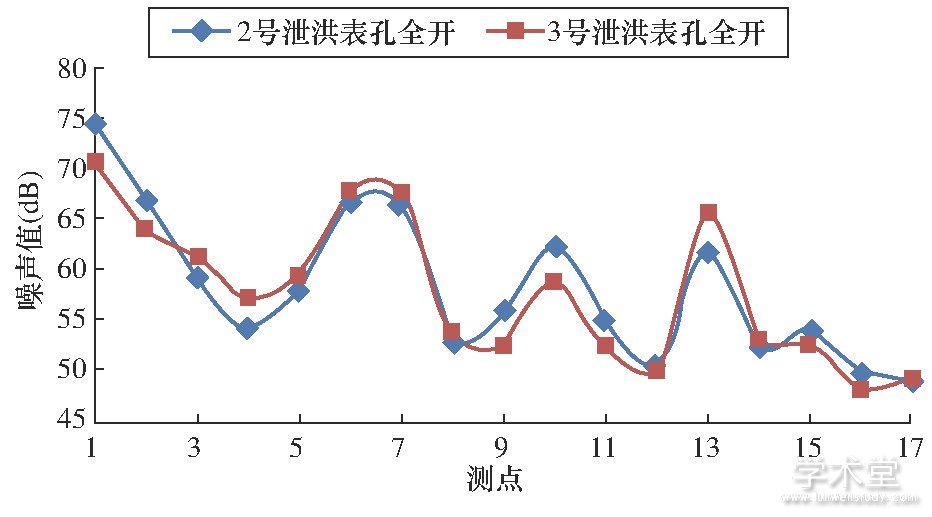
(1~6号观测点分别代表1SL1~1SL6, 7号观测点代表SD, 8、9号观测点代表Q4、Q5, 10~17观测点代表2SL1~2SL8) (The measuring points No.1 to No.6 represent 1SL1 to 1SL6, No.7 represents SD, No.8 and No.9 represent Q4 and Q5, and No.10 to No.17 represent 2SL1 to 2SL8, respectively)
图5 泄洪时右岸噪声分布Fig.5 Noise distribution on right bank during flood discharge
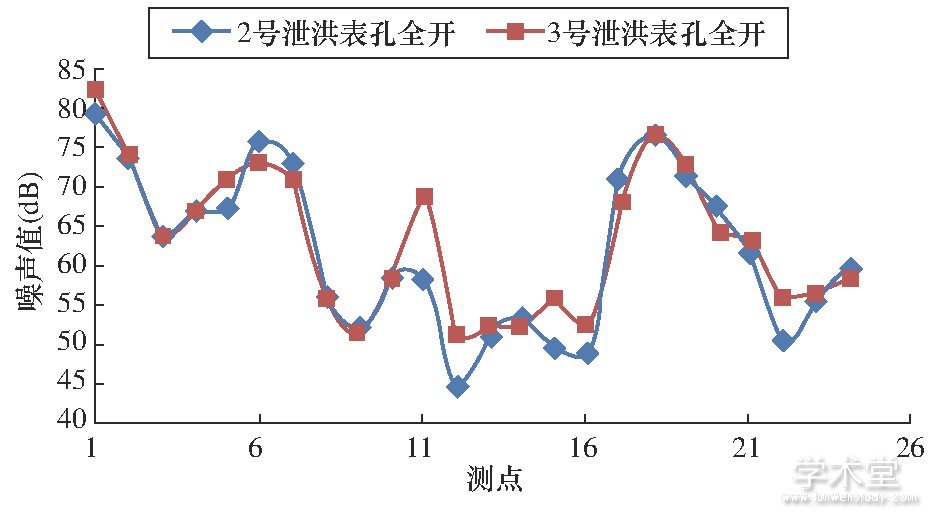
(1~2号观测点分别代表1R8~1R9, 3~5号观测点代表Q1~Q3, 6~16号观测点代表2SR1~2SR11, 17号观测点代表左坝肩点, 18号观测点代表SD, 19~24观测点代表3SR1~3SR6) (The measuring points No.1 and No.2 represent 1R8 and1R9, No.3 to No.5 represent Q1 to Q3, No.6 to No.16represent 2SR1 to 2SR11, No.17 represents the left bank abutment, No.18 represents SD, and No.19 to No.24represent 3SR1 to 3SR6, respectively)
2.3 各泄洪孔组合工况噪声分布规律
分析表3及图6、图7可知:各组合工况泄洪时测点噪声值较泄洪前总体增大。3号表孔+2号、5号中孔全开泄洪与1、2、5、6号中孔全开泄洪时, 除右岸中线公路3个测点噪声值相差13.4%~18.9% (相对1、2、5、6号中孔全开泄洪, 下同) 之外, 其他各测点噪音值基本相当, 介于0~10.3%。2、3、4号表孔泄洪时, 左岸噪声值比其他3个工况总体略小。2号表孔+2号、5号中孔全开泄洪时, 左右岸噪声值总体较小。各工况泄洪时, 左岸坝顶公路、右岸中线公路、右岸坝顶公路沿程和坝顶噪声差值介于0~25.2%。观测点距离大坝坝址越远, 噪声值越小。
3 结束语
(1) 坝身泄洪各工况下, 高水头大流量泄洪消能会引起局部区域噪声的变化, 实测结果总体表明, 坝身泄洪会造成局部声场的变化。
(2) 各工况的不同高程的噪声随着距离大坝坝址距离的增加, 噪声影响总体呈现递减趋势。各工况泄洪时测点噪声值较泄洪前总体增大。
(3) 各工况泄洪时, 左岸坝顶公路、右岸中线公路、右岸坝顶公路沿程和坝顶噪声值相差不大。
表3 各泄洪孔组合工况泄洪噪音值统计表Tab.3 Flood discharge noise value statistics of each flood discharge outlets combined working condition dB
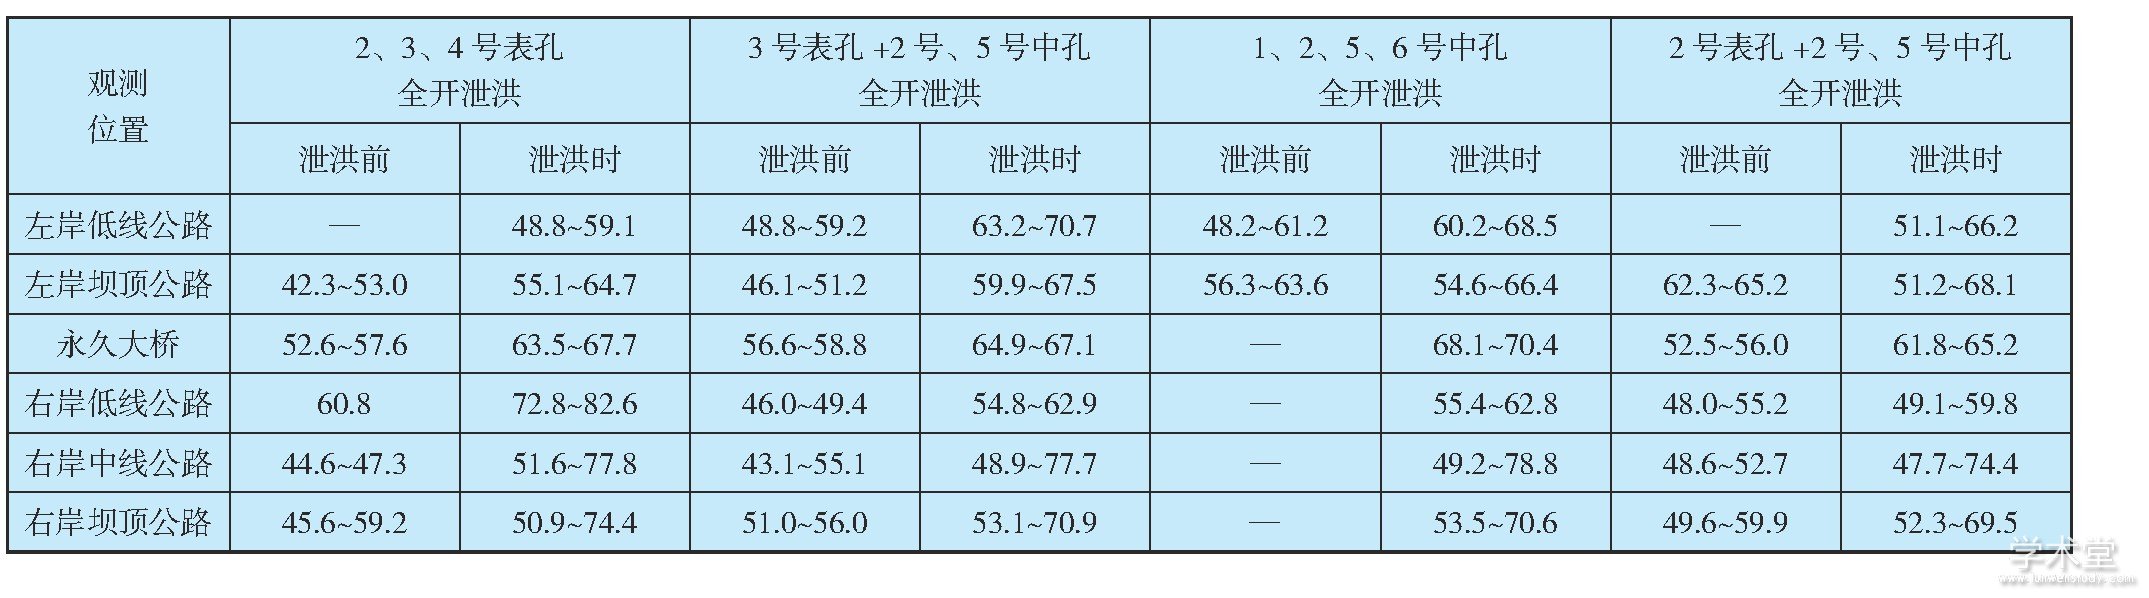
图6 泄洪时左岸噪声分布Fig.6 Noise distribution on left bank during flood discharge
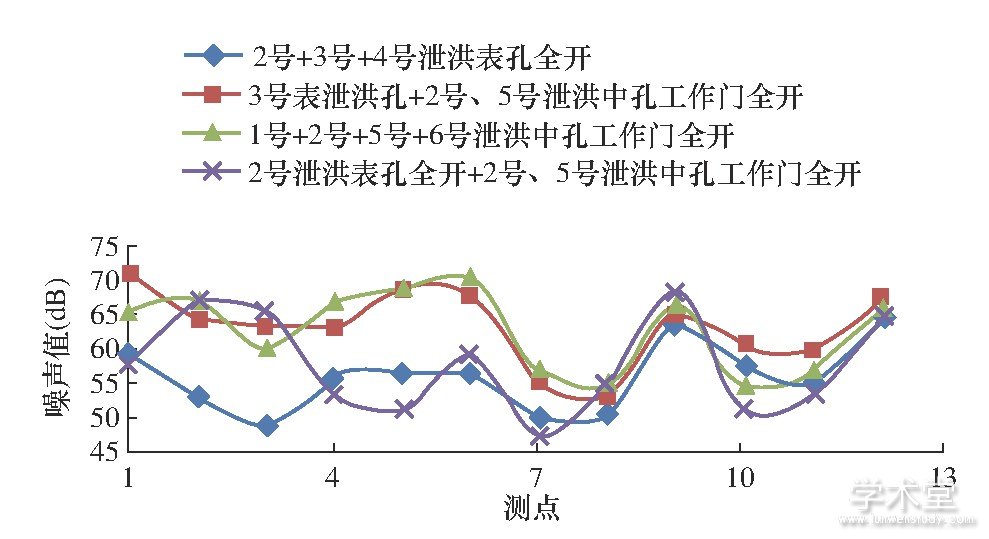
(1~5号观测点分别代表1SL2~1SL6, 6号观测点代表SD, 7、8号观测点代表Q2、Q3, 9~12观测点代表2SL1~2SL4) (The measuring points No.1 to No.5 represent 1SL2 to 1SL6, No.6 represents SD, No.7 and No.8 represent Q2 and Q3, and No.9 to No.12 represent 2SL1 to 2SL4, respectively)
图7 泄洪时右岸噪声分布Fig.7 Noise distribution on right bank during flood discharge
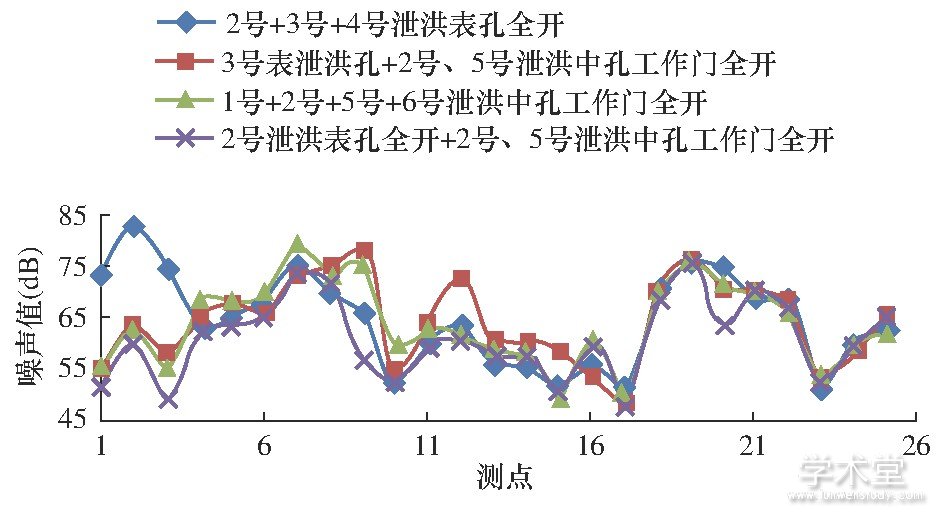
(1~3号观测点分别代表1R7~1R9, 4~6号观测点代表Q1~Q3, 7~17号观测点代表2SR1~2SR11, 18、19号观测点代表SD1、SD2, 20~25观测点代表3SR1~3SR6) (The measuring points No.1 to No.3 represent 1R7 to 1R9, No.4 to No.6 represent Q1 to Q3, No.7 to No.17 represent2SR1 to 2SR11, No.18 and No.19 represent SD1 and SD2, and No.20 to No.25 represent 3SR1 to 3SR6, respectively)
(4) 噪声场以河道两岸距水垫塘较近区域变化明显。若以噪声值增加8dB计算, 泄洪噪声最大影响范围为坝下约1.3km (即右岸卡点) , 中控楼室外最大噪声值可达74.4dB, 对中线公路、小湾大桥区域的影响较小。
综上所述, 泄洪噪声影响范围在2km以内, 泄洪噪声对中控楼楼内工作人员影响很小。
参考文献:
[1]李万军, 雷霄雯, 王协康.高坝泄水雾化机理探讨与防治措施综述[J].水利规划与设计, 2014 (3) :42-45.LI Wanjun, LEI Xiaowen, WANG Xiekang. Discussion on the mechanism of atomization of high dam discharge and prevention measures[J]. Water Resources Planning and Design, 2014 (3) :42-45.
[2] 张文皎.高坝泄洪诱发低频声波原型观测与机理研究[D].天津:天津大学, 2015.
[3]罗正英, 文豪.龚嘴水电站环境量实测资料分析[J].甘肃水利水电技术, 2015, 51 (12) :50-53.LUO Zhengying, WEN Hao. Analysis on measured data of environmental quantity of Gongzui hydropower station[J].GANSU Water Resources and Hydropower Technology, 2015, 51 (12) :50-53.
[4]郑文新.东风水电站泄洪振动原型观测分析[J].南水北调与水利科技, 2006, 4 (1) :57-59.ZHENG Wenxin. Observation&analysis of vibration prototype for flood release in Dongfeng hydropower station[J]. South-toNorth Water Transfers and Water Science&Technology, 2006, 4 (1) :57-59.
[5]王继敏, 杨弘.锦屏一级水电站泄洪消能关键技术研究[J].人民长江, 2017, 48 (13) :85-90.WANG Jimin, YANG Hong. Research on key technology of flood discharge and energy dissipation for Jinping hydropower station[J]. Yangtze River, 2017, 48 (13) :85-90.
[6]练继建.高坝泄洪安全关键技术研究[J].水利水电技术, 2009, 40 (8) :80-88.LIAN Jijian. Key technologies for safety of high dam flood discharge[J]. Water Resources and Hydropower Engineering, 2009, 40 (8) :80-88